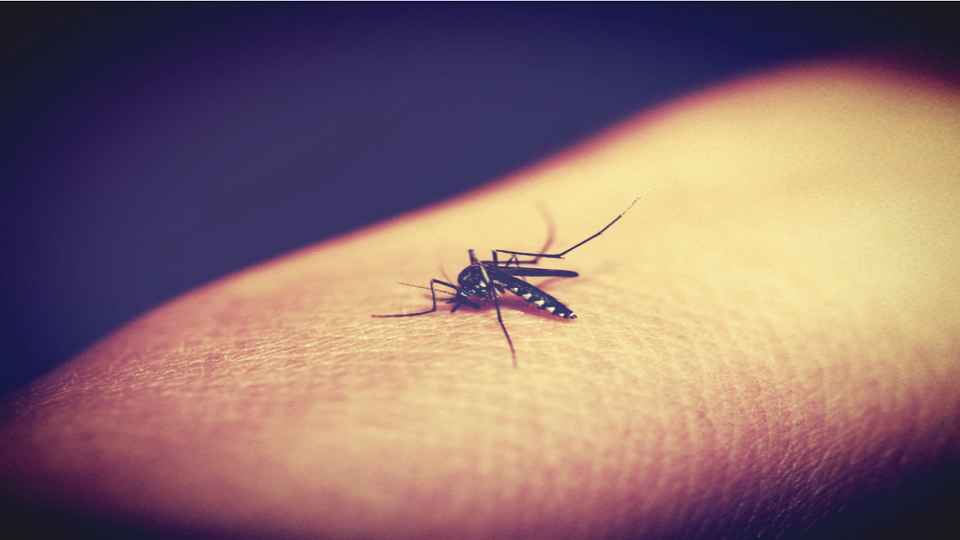
Still water breed death!!! Fight Dengue
Dengue fever has come to the limelight these days because of its frequent outbreaks in various parts of the world. The dengue virus, a member of the genus Flavivirus of the family Flaviviridae, is an arthropod-borne virus that includes four different serotypes (DEN-1, DEN-2, DEN-3, and DEN-4). The World Health Organization (WHO) considers dengue as a major global public health challenge in the tropic and subtropics nations. They estimate that about 390 million dengue virus infections occur every year of which 96 million manifests clinically. The infection has spread over 128 countries globally while 3.9 billion people are at risk and approximately 70% of the incidences are reported from Asia.
Some might not know that at present, Dengue has become the most important vector-borne emerging and re-emerging infectious disease in Sri Lanka as well leading to vast economic and social burden. With the seasonal transmission, higher rainfalls increase not only the availability of the breeding containers for dengue vector mosquitoes but also favorable environmental conditions, viz. humidity, and temperature, for its development.
Vector controlling is the best approach to control disease transmission in the country since neither a drug nor a specific vaccine is being practiced yet. Chemical control methods such as selective indoor residual insecticide spraying, and insecticide-treated nets (ITNs) were currently used to control the disease transmission. Thermal fogging is used in Sri Lanka as the last option in vector control methods with portable or vehicle-mounted fog generators.
However, in the absence of an effective drug or vaccine specific to the virus, the menace seems to be recurrent and difficult to control. Need for Effective surveillance of risk localities in high-risk areas to control dengue transmission remained at large over the past years.
Until recently a group of dedicated scientists was able to develop a propitious solution through their research, “Multivariate Spatio-temporal approach to identify vulnerable localities in dengue risk areas using Geographic Information System (GIS)” conducted at the Molecular Medicine Unit, Medical Faculty, Ragama.
This publication was published on February 18th, 2021, in “Nature Briefing” which is one of the world’s leading science journals that publishes the finest peer-reviewed research in all fields of science and technology. Below mentioned authors were successful in presenting this innovation.

Dr. Sameera D. Viswakula
Department of Statistics,
Faculty of Science,
University of Colombo
Colombo 07, Sri Lanka.
Dr. Gayan P. Withanage
Research Scientist
Sri Lanka Institute of Biotechnology

Mr. Malika Gunawardena
Postgraduate Institute of Science, University of Peradeniya, Peradeniya, Sri Lanka.

Mr. Krishantha Samaraweera
Epidemiology Unit, Office of the Regional Director of Health
Services, Gampaha, Sri Lanka.
Prof.Nilmini S. Gunawardena
Molecular Medicine Unit,
Faculty of Medicine,
University of Kelaniya,
Ragama, Sri Lanka.
Prof. Menaka D. Hapugoda
Molecular Medicine Unit,
Faculty of Medicine,
University of Kelaniya,
Ragama, Sri Lanka.
Over 10 years, the second-highest prevalence of dengue in Sri Lanka is observed in the Gampaha District in the Western province with a total of 186,101, the highest number of dengue incidence reported in the year 2017.
GIS-based risk predictive models which can be used to identify risked localities are a need of the moment to control dengue transmission, yet they are not available for the district, nor for the country. Therefore, this study focused on analyzing the spatial and seasonal distribution of dengue incidence and ecological factors to develop GIS-based risk models for the identification of risk localities in high-risk areas to control dengue transmission. Graphical Information System (GIS)-based risk models can be identified as the key factor of this study. They were prepared to identify the risk areas and factors in the study areas in Gampaha District. Separate layers were developed representing locations of dengue patients and positive breeding containers of Aedes dengue vector mosquitoes, roads, land use, total buildings, public places, and elevations in each study area. The schematic structure is illustrated in the figure below (Figure4). Kernel density and Euclidean distance-based approaches are widely used in the raster development of GIS modeling. Kernal density was used to fit a smoothly tapered surface to point layers while Euclidean distance was used to identify close exposures of polygon layers.
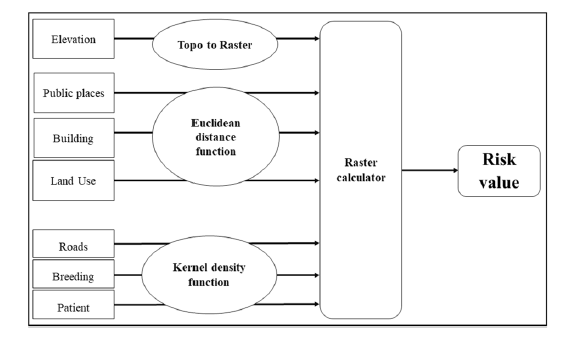
Figure 4: Systematic flow chart of risk model development
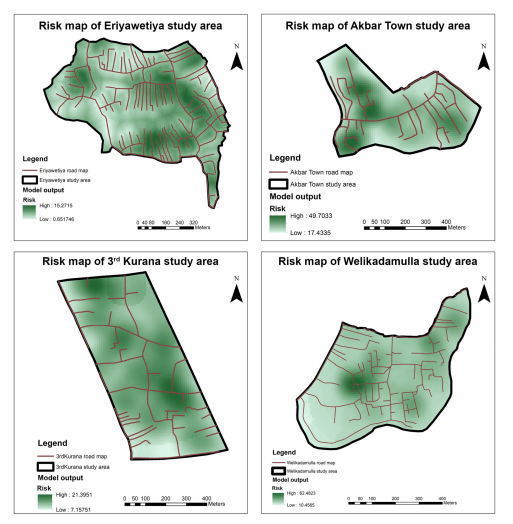
Figure 5- Risk maps- composed using Esri ArcGIS 10.21. Satellite imagery comparisons were illustrated in Supplementary Figures S1-S4.
Further, GIS-based risk maps have been used to identify the risk localities in the dengue high-risk study areas in Gampaha District.
Figure 5 shows the final outcomes of the model for each study area.
High-risk localities were illustrated in the dark green color while the low-risk localities were illustrated in white. Another noticeable fact is, when comparing the generated risk maps with satellite imageries, vegetation covers were observed in high-risk localities in all study areas. The reason could be that the dengue vector mosquito can survive sound in vegetation covers.
When comparing the intensity maps (Figure 6) with generated risk maps (Figure5), differences in localization of intensities were observed especially in Eriyawetiya and Walikadamulla study areas.
In Intensity maps (Figure6) generated from the Poisson point process model, the high-risk localities were illustrated in yellow while the low-risk localities were illustrated in blue. Variation of intensity levels are scaled adjacently to the intensity map of the study areas,
- Eriyawetiya
- Akbar Town
- 3rd Kurana
- Welikadamulla
During the mathematical modeling of patient locations of dengue in the study areas using Poisson point pattern models, different point pattern intensities were predicted for dengue incidences in the study areas. However, the highest intensity range was observed in the Eriyawetiya study area while the lowest was observed from 3rd Kurana.
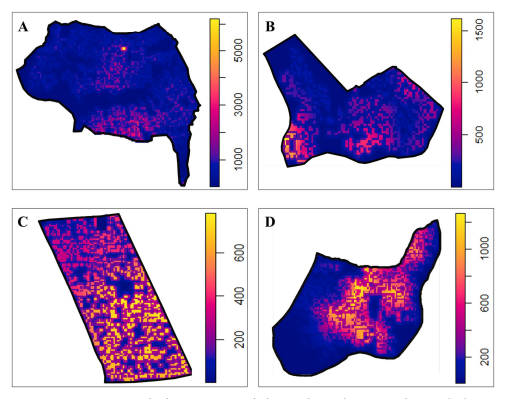
Figure 6- Predicted point pattern intensity for dengue incidences in the respective study areas.
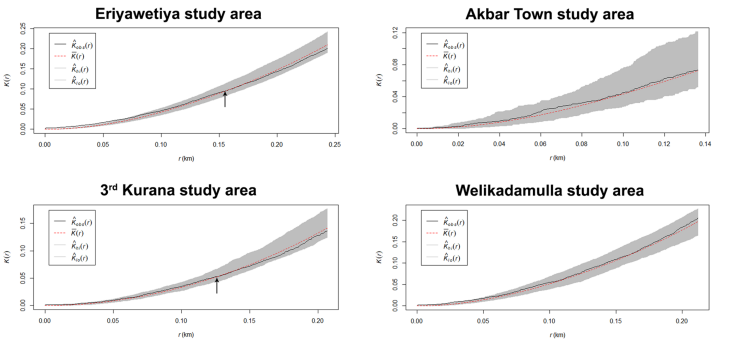
Figure 7 – Observed Ripley’s K-functions and simulated envelopes for Poisson point process models in the study areas.
According to the above observed Ripley’s K-functions of the developed Poisson multivariate models for the study areas, in Eriyawetiya and 3Rd Kurana study areas, dengue incidences were clustered at some scales and be dispersed at others while only clustering was observed in the Akbar Town and Welikadamulla areas. During this analysis, they have been considered both isotropic and translation edge correction methods, since edge effects arising from the unobserved patient locations outside the study area can be hampered when estimating the K –functions.
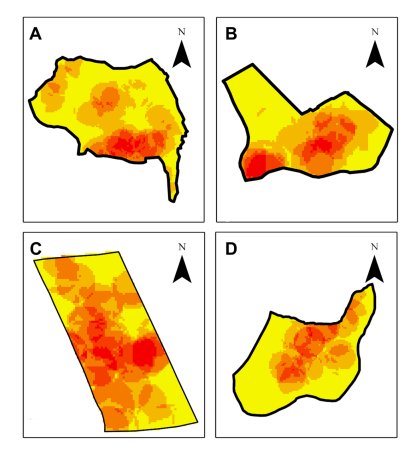
Figure 8 – Distribution of dengue incidences in the southwest monsoon period in the study areas. The figure was generated using Esri ArcGIS 10.2.1
Figure 8 shows that the identification of the distribution of dengue incidences in the study high-risk areas in different monsoon periods. When analyzing the distribution of dengue incidences in the monsoon periods, the highest number of dengue incidences were reported from the southwest monsoon period because of higher rainfall. That paves the way to increase not only the availability of the breeding containers for dengue mosquitoes but also favourable environmental conditions, viz. humidity and temperature, for its development.
As we discussed Dengue has been prevalent in Sri Lanka over years with a high risk of outbreaks. Even though proper medication method is not practiced yet, identification of high risked localities would help to minimize the effect of dengue outbreaks from an early stage. So, this committed group of scientists was able to provide a solution to the matter by introducing a GIS-based model identification process. As they present the output of this developed model can be used as an early warning tool to explore the current situation of dengue in an area.
In addition to that, the information grasped will be provided to the healthcare authorities so they can easily understand the disease propagation patterns and can allocate public healthcare resources effectively.
Furthermore, this GIS-based model can be developed to illustrate the scenario of the present situation in real-time in risked areas by coupling it with mathematical modeling and phylogenetic Approaches.
The call of research for a method to avoid a killer has been answered by this inquisitive team by providing a promising solution with the use of GIS-based modeling techniques.
Reference:
Gayan P. Withanage, Malika Gunawardana, Sameera D. Viswakula, Krishantha Samaraweera, Nilmini S. Gunawardena & Menaka D. Hapugoda (Published online : 18 February 2021)
Multivariate Spatio-temporal approach to identify vulnerable localities in dengue risk areas using
Geographic Information System (GIS)
Multivariate Spatio-temporal approach to identify vulnerable localities in dengue risk areas using Geographic Information System (GIS) | Scientific Reports (nature.com)
Dengue fever – Wikipedia
Written by: Tharushi Uththara Ranasinghe
